Chart box
Note:
The chart box is available in version 2.0.0.0 or higher.
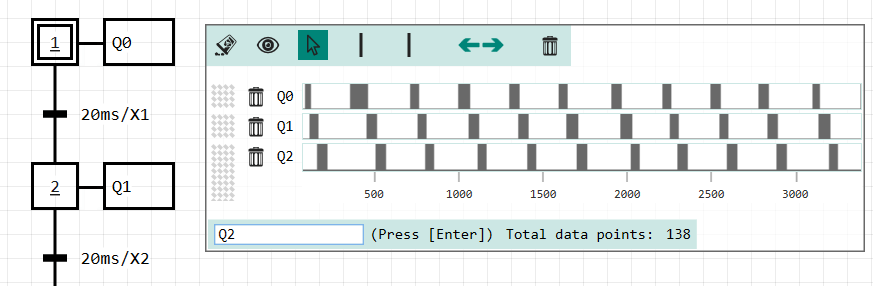
With the Chart Box, Diagrams can be placed directly on the drawing area. Symbols (analog or digital) can then be added.
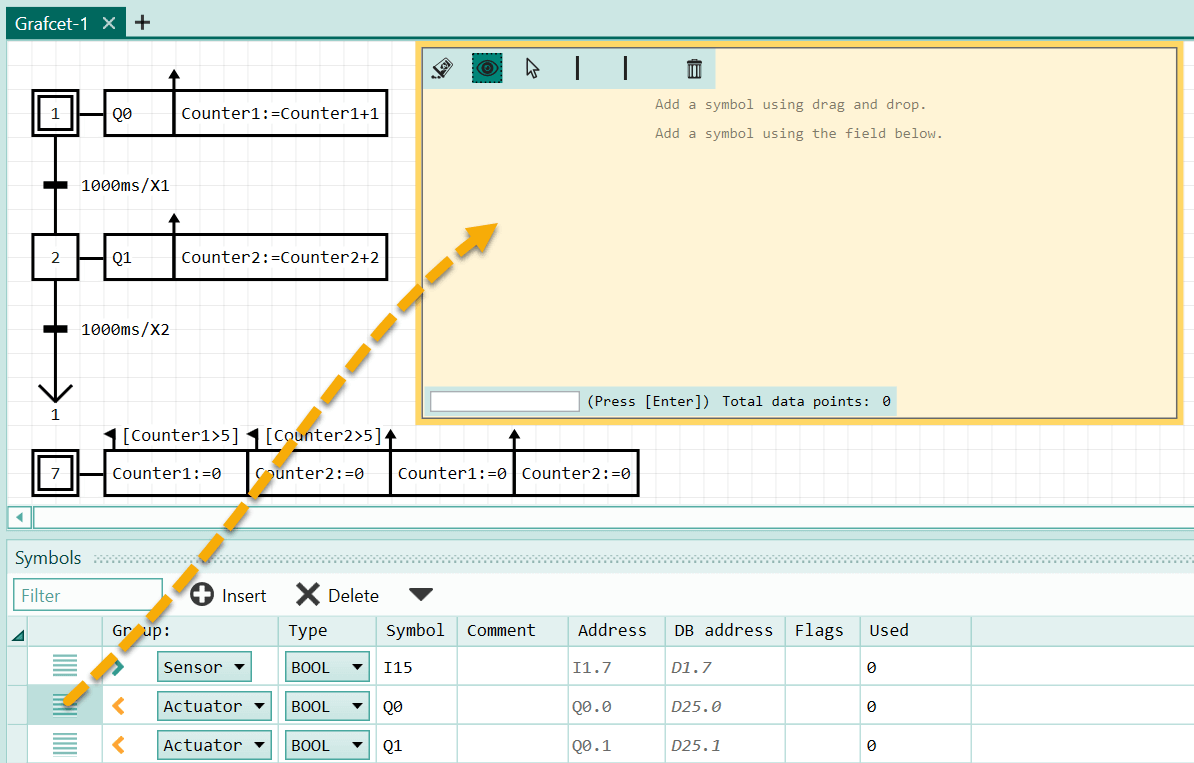
Add Chart Box
Add a chart box via drag & drop:

Add symbol (1)
Add a symbol from the symbol table using Drag&Drop:
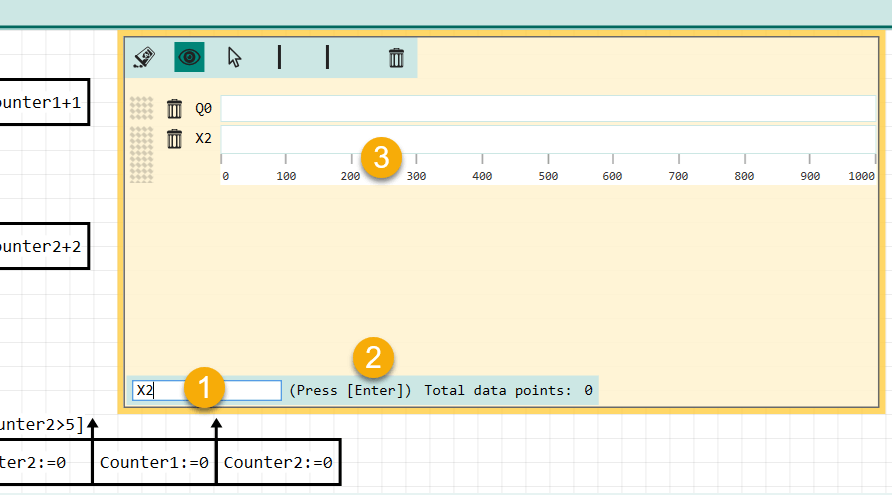
Add symbol (2)
Add a symbol or a step variable via the input field:
The symbol is added after pressing the Return key.
Analog channels
Analog channels are bundled in one diagram (chart) in the standard setting. If the analog signals have very different min-max values, the display may not be optimal. To work around this problem, it is possible to display each analog channel in a separated chart (as with the BOOL signals). This can be set via the context menu of the chart box (right mouse button).
Video
In the following video symbols are added and the simulation is started:
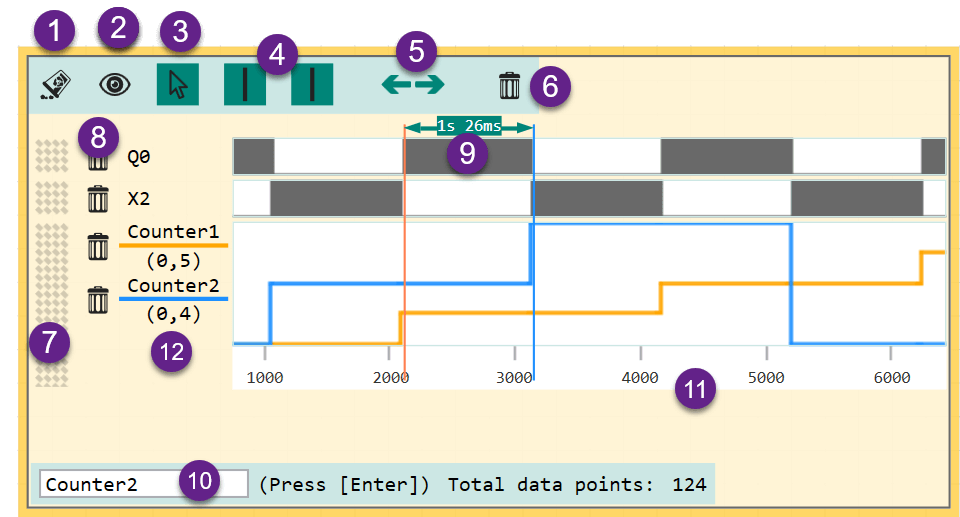
Elements of a chart box
| No | Description |
|---|---|
| 1 | Erase all data points |
| 2 | Show total time period |
| 3 | Manual period |
| 4 | Time measurements with cursor 1 and cursor 2 |
| 5 | Current mode=move. Press Ctrl for scaling |
| 6 | Clear the chart completely |
| 7 | Sorting the symbols (channels) by drag & drop |
| 8 | Delete a symbol |
| 9 | Time span between the cursor 1 and 2 |
| 10 | Add channel manually (After Return key) |
| 11 | Resize Analog Chart |
| 12 | Minimum and maximum value of the chart |
Good to know
- Step variables can only be entered via the manual input field, as the step variables are not part of the symbol table.
- The chart box displays on the X-axis the milliseconds since the start of the recording.
- A whole chart box can be copied (Copy&Paste). The data points are not copied.
- Several chart boxes can be placed. Also on different Grafcet pages.
- The maximum recording duration is 30 minutes. If the recording time exceeds 30 minutes, new data points are no longer added to the chart.
- The chart can also be printed. In this case, the controls of the chart-window (buttons, ...) are not printed. The controls can be hidden via the context menu.
- The size of the chart does not adjust automatically. You can use the mouse to resize the chart box on the right and bottom edges.
- The data points are stored in the project file when the project is saved. This can strongly influence the size of the file. If necessary, delete the data points before saving. (See point 1 in the table)